
Inventory Tracking Systems: How Real-Time Stock Monitoring Works

Real-time stock monitoring describes systems that continuously record where individual items and aggregate inventory levels are located and how they change. Such systems combine unique identifiers on items, data-capture hardware, local or cloud data processing, and user interfaces so teams can view current quantities across warehouses, stores, and transit. In practical terms this means events—receipts, picks, transfers, returns—are captured promptly and converted into updated records that reflect available stock for operational use. The description here focuses on the technical and process aspects of these monitoring flows rather than recommending specific purchases or providers.
Key technical layers in these systems typically include item identification, automated capture, network transmission, middleware or platform processing, and reporting. Identification may use printed barcodes or radio-frequency tags; capture can be performed by handheld scanners, fixed readers, or smartphone apps; transmission often relies on local Wi‑Fi or cellular networks to cloud services; and software reconciles events against master data. In U.S. logistics and retail environments these components are often integrated with point-of-sale systems, warehouse management systems, and transport management platforms to maintain synchronized counts across multiple locations.
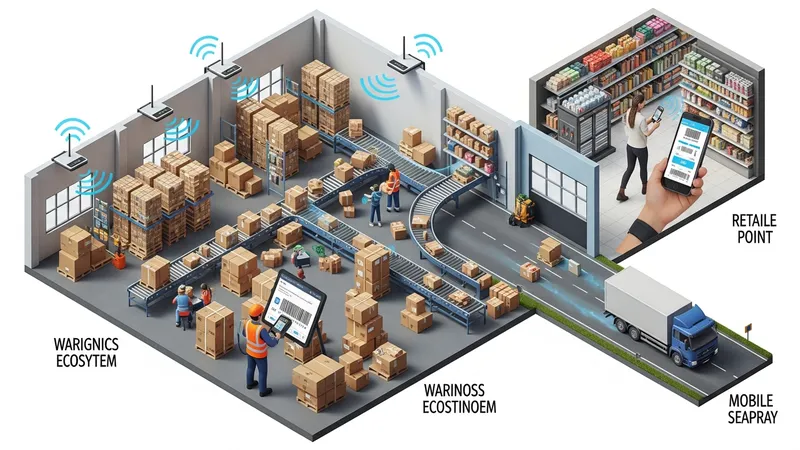
- Barcode scanning systems — handheld and fixed optical scanners that read 1D and 2D codes on cases and items; commonly used for receiving, picking, and shelf audits. Typical handheld scanner price ranges in U.S. channels may be approximately $200–$1,200 per unit. Example vendor pages: Zebra Technologies.
- RFID systems — passive RAIN RFID tags and readers for automated, line-of-sight-independent reads in high-volume or high-mobility environments; tag unit costs vary from cents to dollars per tag depending on volume and type. Typical RFID reader pricing for U.S. deployments can range from about $500–$3,000 per reader. Reference: GS1 US and NIST materials on RFID considerations.
- Cloud-based inventory management platforms — SaaS systems that ingest capture events, reconcile stock, and expose dashboards and APIs for integrations. Subscription pricing in U.S. markets often ranges from roughly $50 per month for simple offerings to $1,000+ per month for enterprise plans depending on modules and user counts. Examples of vendor types include enterprise resource planning suites and specialized inventory SaaS.
Comparisons among these approaches typically center on read frequency, environmental suitability, and cost per transaction. Barcode scanning is broadly adopted at retail points of sale and in many warehouses because of low unit costs and mature tooling, though it often requires human action to scan each item. RFID can enable higher read throughput and hands-free inventory counts, which may suit distribution centers and high-volume retail backrooms but introduces tag and infrastructure costs and may require careful site surveying for reliable reads. Cloud platforms can centralize visibility across locations but depend on consistent network connectivity and well-defined integration strategies with local hardware.
Data capture and event processing workflows often follow a pattern: capture at the edge, local buffering for intermittent connectivity, transmission to middleware, and reconciliation against master inventory records. In U.S. deployments, teams commonly implement local buffering in handheld devices or gateway appliances to avoid data loss during temporary network outages. Middleware can apply business rules—such as lot or serial number tracking, location hierarchy, and reservation logic—before updating the canonical inventory record. Accurate time-stamping and source identifiers are important for auditability and downstream analytics.
Reporting and analytics functions in these systems may provide real-time dashboards, alerts for low stock thresholds, and historical reports used for forecasting and replenishment planning. In U.S. retail and distribution contexts, visibility often supports same-day fulfillment decisions, cross-dock activities, and replenishment cadence adjustments. Data integrity practices such as periodic cycle counts, reconciliation between receiving manifests and system records, and usage of immutable event logs may be used to maintain trust in the real-time view without implying any guaranteed outcomes.
Integration patterns commonly involve APIs, message queues, and middleware connectors that bridge hardware vendors and cloud platforms. U.S. enterprises may use RESTful APIs, MQTT, or cloud provider messaging services to push capture events into inventory services. Considerations here include payload formats (for example, GS1 EPCIS for RFID event capture), handling duplicate events, and mapping location identifiers to corporate site hierarchies. These integration choices typically influence latency, scalability, and the effort required for ongoing maintenance rather than promising fixed performance levels.
In summary, continuous stock monitoring relies on a coordinated set of identifiers, capture devices, connectivity, and platform processing to present current inventory views across sites. Practical deployments in the United States vary by volume, SKU complexity, and operational priorities, and may blend barcode, RFID, and cloud tools to address specific workflows. The next sections examine practical components and considerations in more detail.